Amazon bestsellers are big data
By Christian Prokopp on 2022-05-18
According to an adage, big data is anything too big for Excel, i.e. more than 1,048,576 rows. It is a bit cheek-in-tongue, but, as with many jokes, it is grounded in truth. Many business processes run on Excel to this day. That is an issue when analysing datasets like Amazon product data for valuable insight on pricing, production and supply planning, and new product or category development. Excel cannot load a single country's Amazon bestseller list. Even if you use more scalable systems, many will struggle to analyse the more comprehensive product catalogue, complex product and category relationships, or changes over time.

For context, the Amazon product catalogue has 100s of millions of products in each country. The bestsellers are a small subset of that, with more than 2 million on Amazon.com and approximately 1.3 to 1.4 million on Amazon.co.uk and Amazon.de. Millions of products would be a sizable catalogue for most businesses but are merely the bestsellers for Amazon. Yet that is only a snapshot in time and insufficient for Analytics. Continuously updating this dataset to create a time series of changes increases its size to billions and billions of rows quickly.
How many active Amazon bestseller categories are there?
Categories are helpful to organise the many products for customers as well as for analysts, operations, supply chain, marketing and other business functions. But even they become numerous on this scale. We counted only the Amazon categories with bestsellers to demonstrate this, ignoring empty categories.
- Amazon.co.uk has 27,894 categories
- Amazon.de has 29,790 categories
- Amazon.com has 42,795 categories
That is the size or even larger than many businesses' product catalogues. Of course, that kind of data would load in Excel easily. However, without the product network graph associated with the categories, the utility of the data is limited.
A taste of the Amazon bestseller data complexity
The bestseller category frequency is a simple example to demonstrate this challenge. How frequently do products become bestsellers in more than one category? For example, a product can be a bestseller in a leaf category like clarinet and its parent category like woodwind. Bestsellers can also appear in different parts of the category graph, e.g. a product may sell well in the fashion and sports part of the category graph. It may even be a bestseller multiple times in the same category via product variations like size or colour.
A detailed category network graph analysis gains insights on product placement to achieve more than one bestseller spot and maximise its sale. It can identify inter and intra-cluster relationships to identify product and category similarities to invest into or identify and discontinue orphaned product lines.
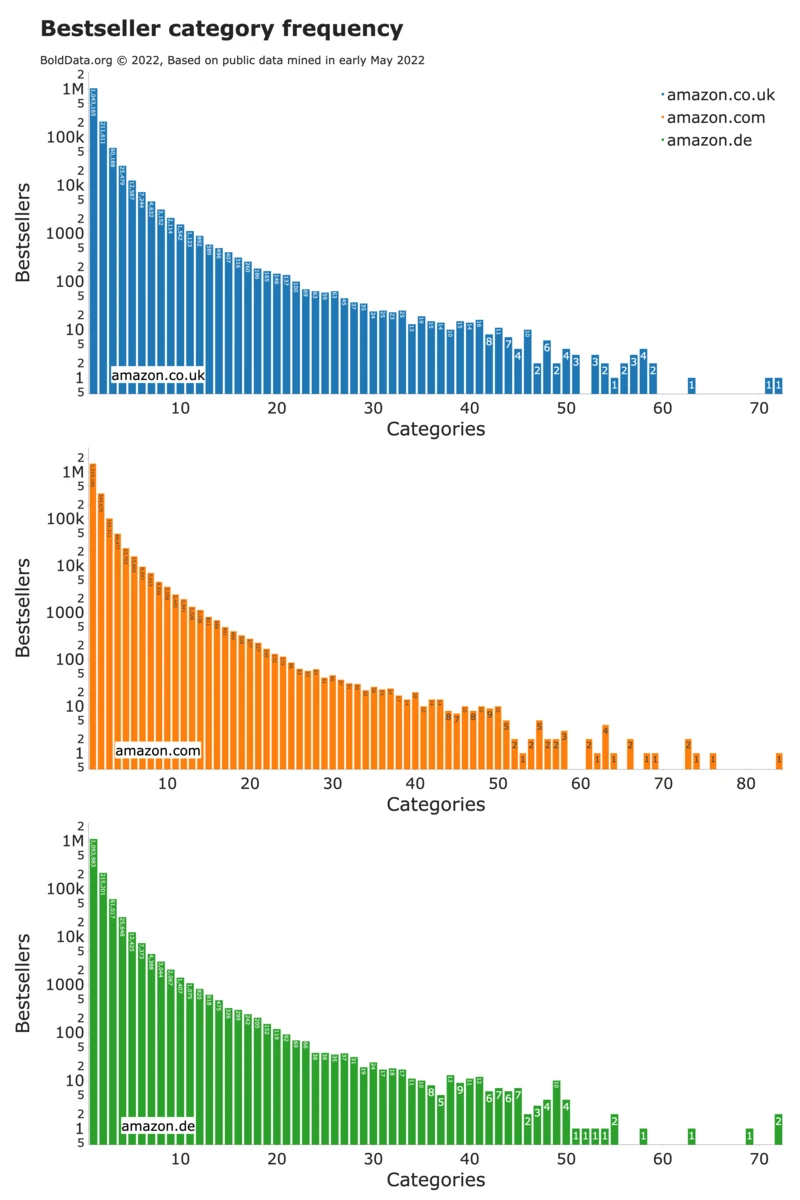
A quick overview shows us that Amazon.co.uk lists 1,377,192 unique products and 2,076,485 bestsellers, which means each best selling product made it into the top 100 in 1.5 categories on average. Amazon.com has 2,090,907 unique products and 3,367,975 bestsellers or 1.61 on average. Amazon.de has 1,431,524 unique products and 2,122,573 or 1.48 on average. Another way to look at it is as a network, e.g., Amazon.com has a bestseller network of 2+ million nodes and 3.3+ million edges.

A more detailed look at the frequency distribution reveals that most products are single category bestsellers (note the log scale on the Y-axes). The remaining products list in multiple categories, and some longtail outliers have surprisingly high category frequency. A closer look reveals many to be clothing with a large number of variations and books available in many formats and categories. The most frequent bestseller ranking in 84 categories is on the Amazon US website, a popular book with many product variants and relevant categories: Sisters Behaving Badly.

Note that if you look at the product page, you will only find a tiny subset of its categories. Bold Data collects a broader array of source data and integrates it and can therefore identify dozens of relationships unavailable from the product page.

Amazon bestsellers graph analysis
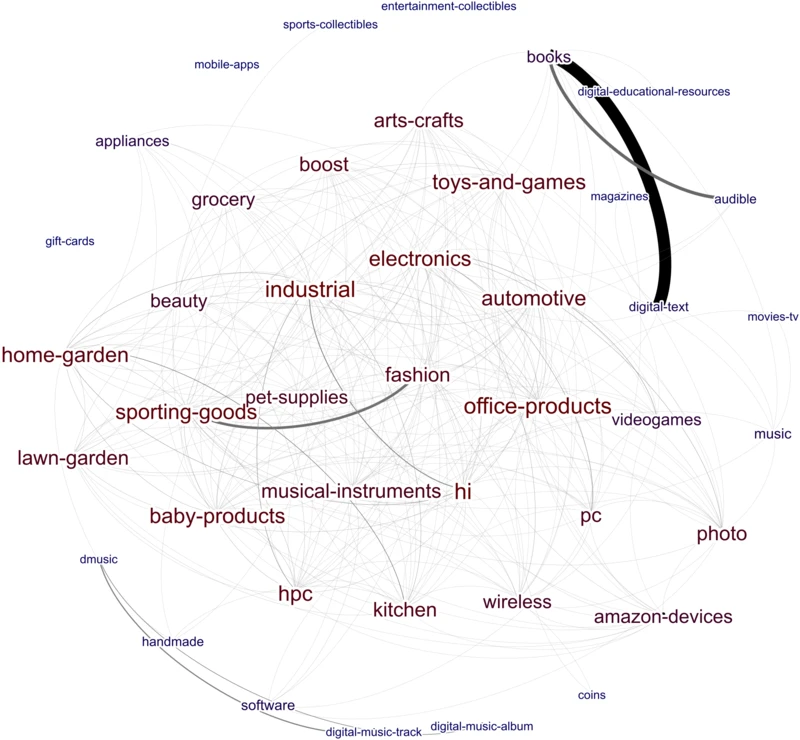
These simple insights already require unique datasets and sophisticated processing capabilities. But once in place, i.e. thanks to Bold Data, such analyses are done quickly and cost-effective. While it exceeds the scope of this post, we can share a peek at the complex network graph underlying the Amazon bestsellers. It can answer some of the questions raised early in the post.

The thickness of a link shows how many bestsellers sold across two categories. The colour (blue to red) and size of a label show how central, i.e. connected a category is. Hence, the graph shows the connectivity and degree of centrality of bestselling top-level categories based on products selling in more than one category, which we aggregated to the top-level categories here. The view is highly simplified since tens of thousands of categories across millions of bestsellers and connections are involved in the underlying network.
Yet the simplified view already reveals facts that intuitively make sense. For example, there is a strong connection between the books, digital-texts and audible categories, or between sporting-goods and fashion. It also shows loosely coupled or disconnected categories on the top level like mobile-apps, gift-cards or coins. We may share more detailed insights on the network analysis in future posts, so be sure to subscribe to our email list (links are at the end of the post and at the top right in the menu).
The Amazon product catalogue is big data
There should be no more question that Amazon level data requires sophisticated data mining, processing and analysis capabilities. Bold Data collects all this data: the product details, the categories, the bestsellers and more. We do it for multiple countries and track changes in the bestsellers, continuously growing the dataset. Consequently, the bestsellers dataset size alone quickly increases to billions of rows, which is big data by anyone's definition.
Most companies are not staffed or equipped to deal with data mining and processing in the billions of products and updates outlined here. It also requires decades of experience, deep specialised know-how and intellectual property. Yet they would benefit significantly from the resulting datasets and analytics. If you sell on Amazon or not, you compete with them and their marketplace sellers on price, availability, category and product development.
Importantly, Bold Data can augment your abilities and turbocharge your insights, whether you use Excel, databases, or more sophisticated data storage and analytics tools. We operate a 24/7 multi-cloud data mining and analysis platform that provides accessible, affordable, quality datasets and analysis, ready to help you make better decisions daily regardless of your tools, industry, and needs. To close the gap to Amazon's data advantage and leapfrog your competitors on insight, contact christian@bolddata.biz.
Note that the data used in this post was collected and analysed in early May 2022 with the Bold Data platform.
Christian Prokopp, PhD, is an experienced data and AI advisor and founder who has worked with Cloud Computing, Data and AI for decades, from hands-on engineering in startups to senior executive positions in global corporations. You can contact him at christian@bolddata.biz for inquiries.
Related Posts

Introducing Tax Shrink
2024-03-14
Tax Shrink is a new online tool that helps owner-operators of Limited companies in the UK calculate and visualise the ideal salary-to-dividend rati...

9 Proven Programming Productivity Prompt Tips for ChatGPT
2023-04-12
Learn to harness the potential of ChatGPT4, your virtual programming partner, with nine prompting tips. Improve your programming skills by communic...

Understanding the Power of ChatGPT
2023-02-07
ChatGPT is a state-of-the-art language model developed by OpenAI, utilising the Transformer model and fine-tuned through reinforcement learning to...

Is Athena Spark a Delta Lake alternative to Databricks?
2022-12-02
Finally. AWS re:Invent 2022 brought the answer to both Databricks and Athena's worst limitations. Athena Spark promises to bring Delta Lake scale-o...

One simple thing companies miss about their Data
2022-08-08
There is one simple thing most companies miss about their data. It has been instrumental in my work as a data professional ever since.

Public data is of public interest
2022-04-25
Public data has an enormous commercial and social impact. For example, in Ukraine, it affects war and peace, and with the Coronavirus, it involves...